Data Insights Report Structure
Data Insights reports are designed to provide an easy and flexible way of tracking the data across several metrics. Please find below the description of the main structural functionalities of the Clickio Data Insights.
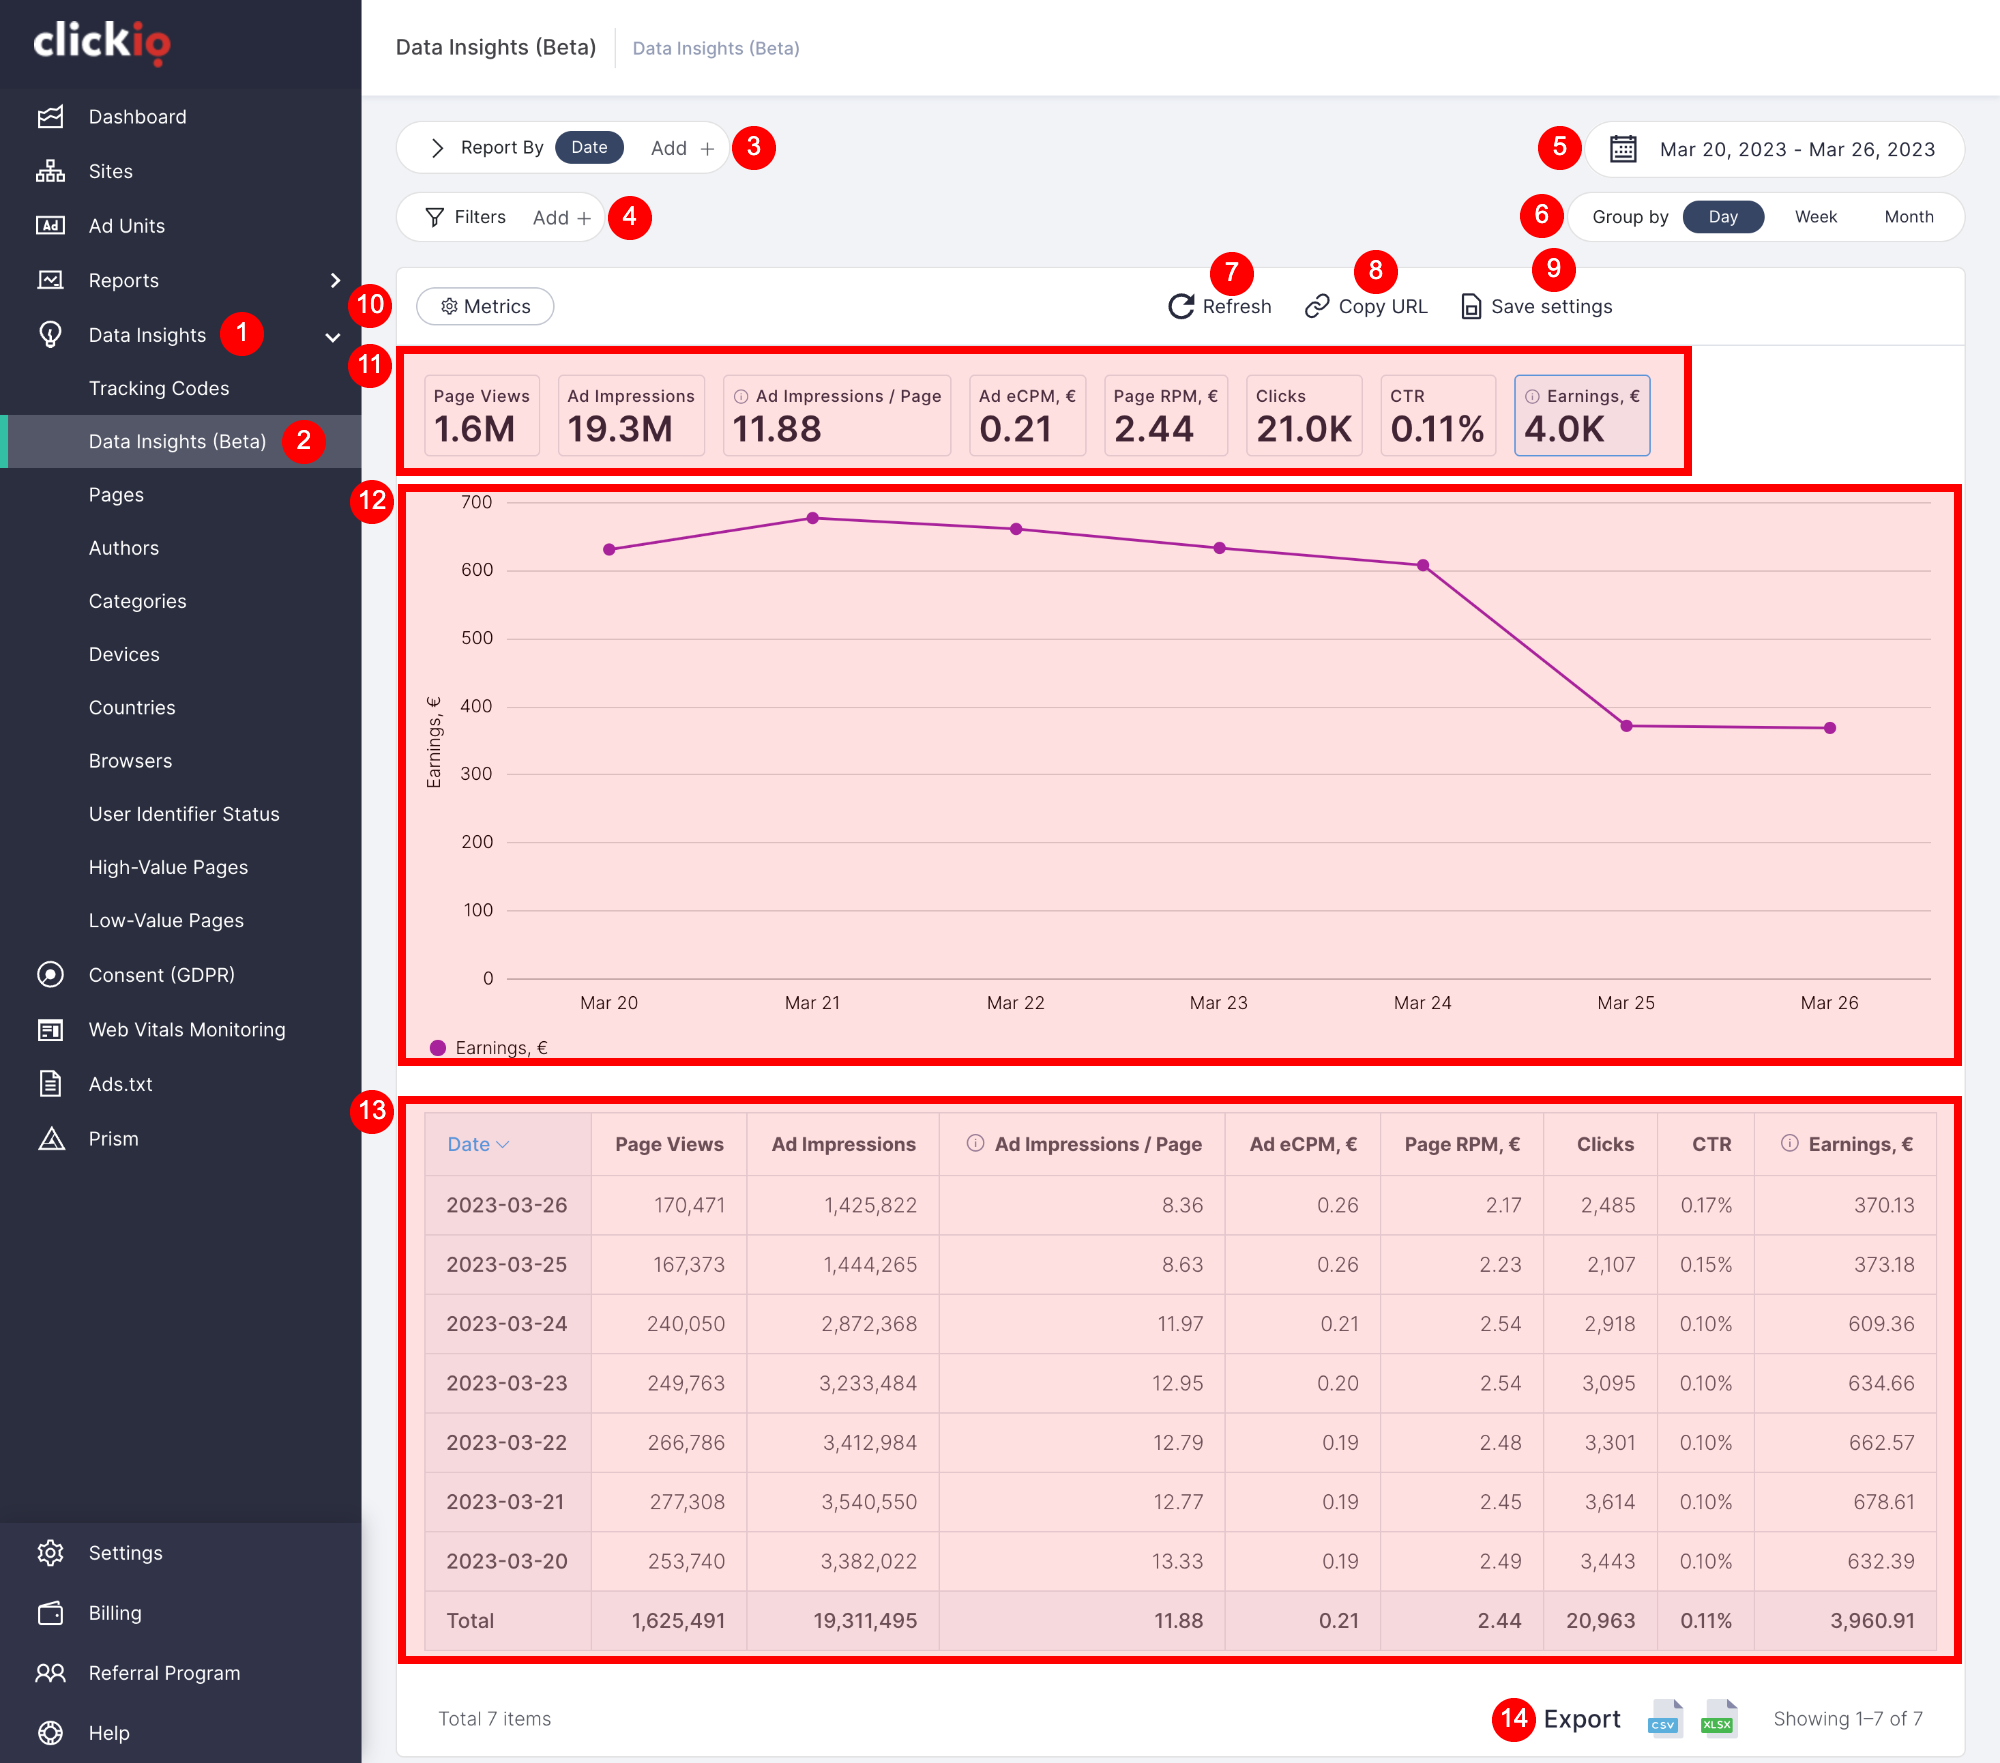
The Data Insights main report is located in [1] Data Insights > [2] Data Insights (Beta) tab. The UI is standard for all Clickio platform reports and consists of the following parts:
- [3] Report by: select single or multiple dimensions to display.
- [4] Filters: refine your data by one or multiple dimensions or metrics.
- [5] Date range control: select the date range.
- [6] Group by: when Report by > Date is chosen, allows you to select grouping by day, week or month.
- [7] Refresh: update data in the report with current custom settings.
- [8] Copy URL: copy the link of the current view of the report to the clipboard.
- [9] Save settings: save the current custom settings of the report.
- [10] Metrics: control the metrics that will be displayed on the scorecards and the table below.
- [11] Scorecards: displays total values for selected metrics.
- [12] Line chart: displays the date dimension as the X-axis (horizontal axis), while the Y-axis (vertical axis) represents the metric measurement.
- [13] Table: tabular view of selected dimensions and metrics.
- [14] Export data: Export or download your report data in .csv or .xlsx format.