Prism Dashboard A/B Test
If Prism is active on your site, the Prism dashboard will be accessible within your account.
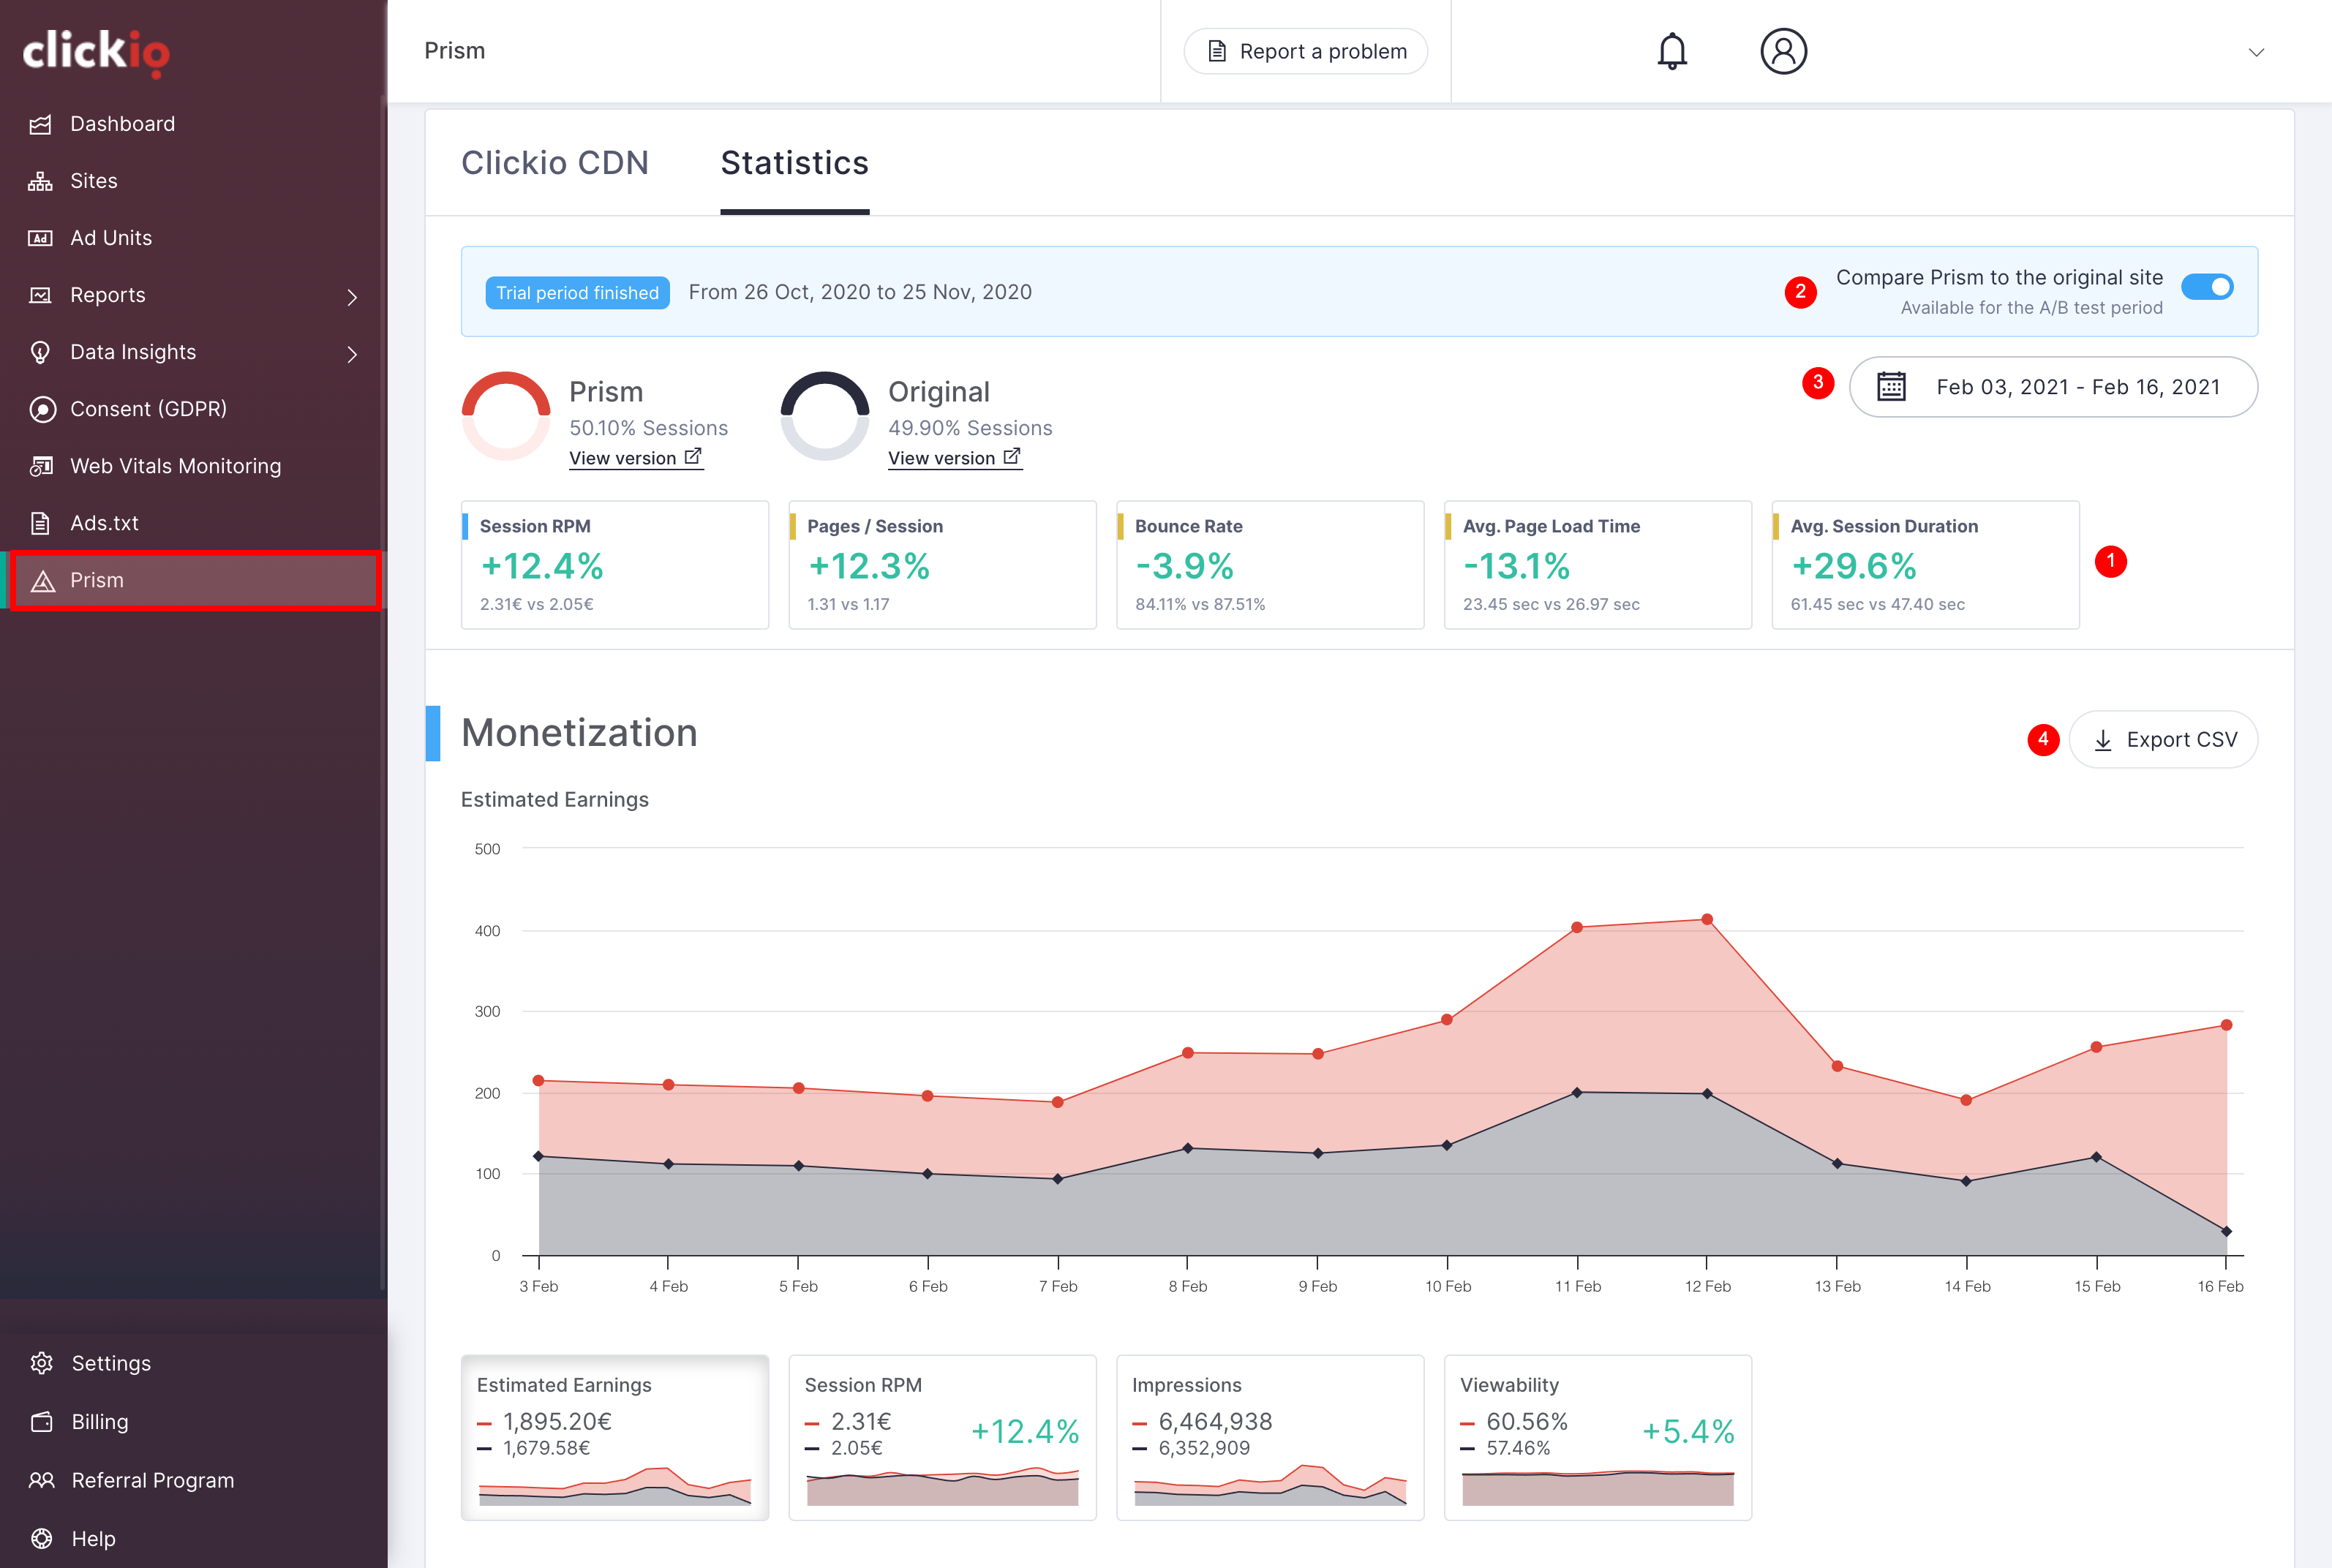
The Prism Dashboard A/B Test report compares the performance of Prism against the original version of your site. During the trial period, which lasts 30 days from the Prism launch, data is collected and compared.
1. Metrics Overview: The Prism A/B Test dashboard comprises three blocks of metrics: Monetization, Mobile Traffic, and UX & Speed. Each section contains unique metrics, with detailed descriptions available here.
2. Comparing Prism to the Original Site: To switch the report to the Prism 100% Dashboard, toggle off the "Compare Prism to the original site" button.
3. Adjusting the Calendar Period: Modify the date range by accessing the calendar and selecting the desired timeframe for data analysis.
4. Exporting Data: Easily export data from the Prism dashboard in CSV format for further analysis. Click on the "Export CSV" button to initiate the export process. Note that the exported data corresponds to the period currently selected in the calendar.