Dashboard
Overview
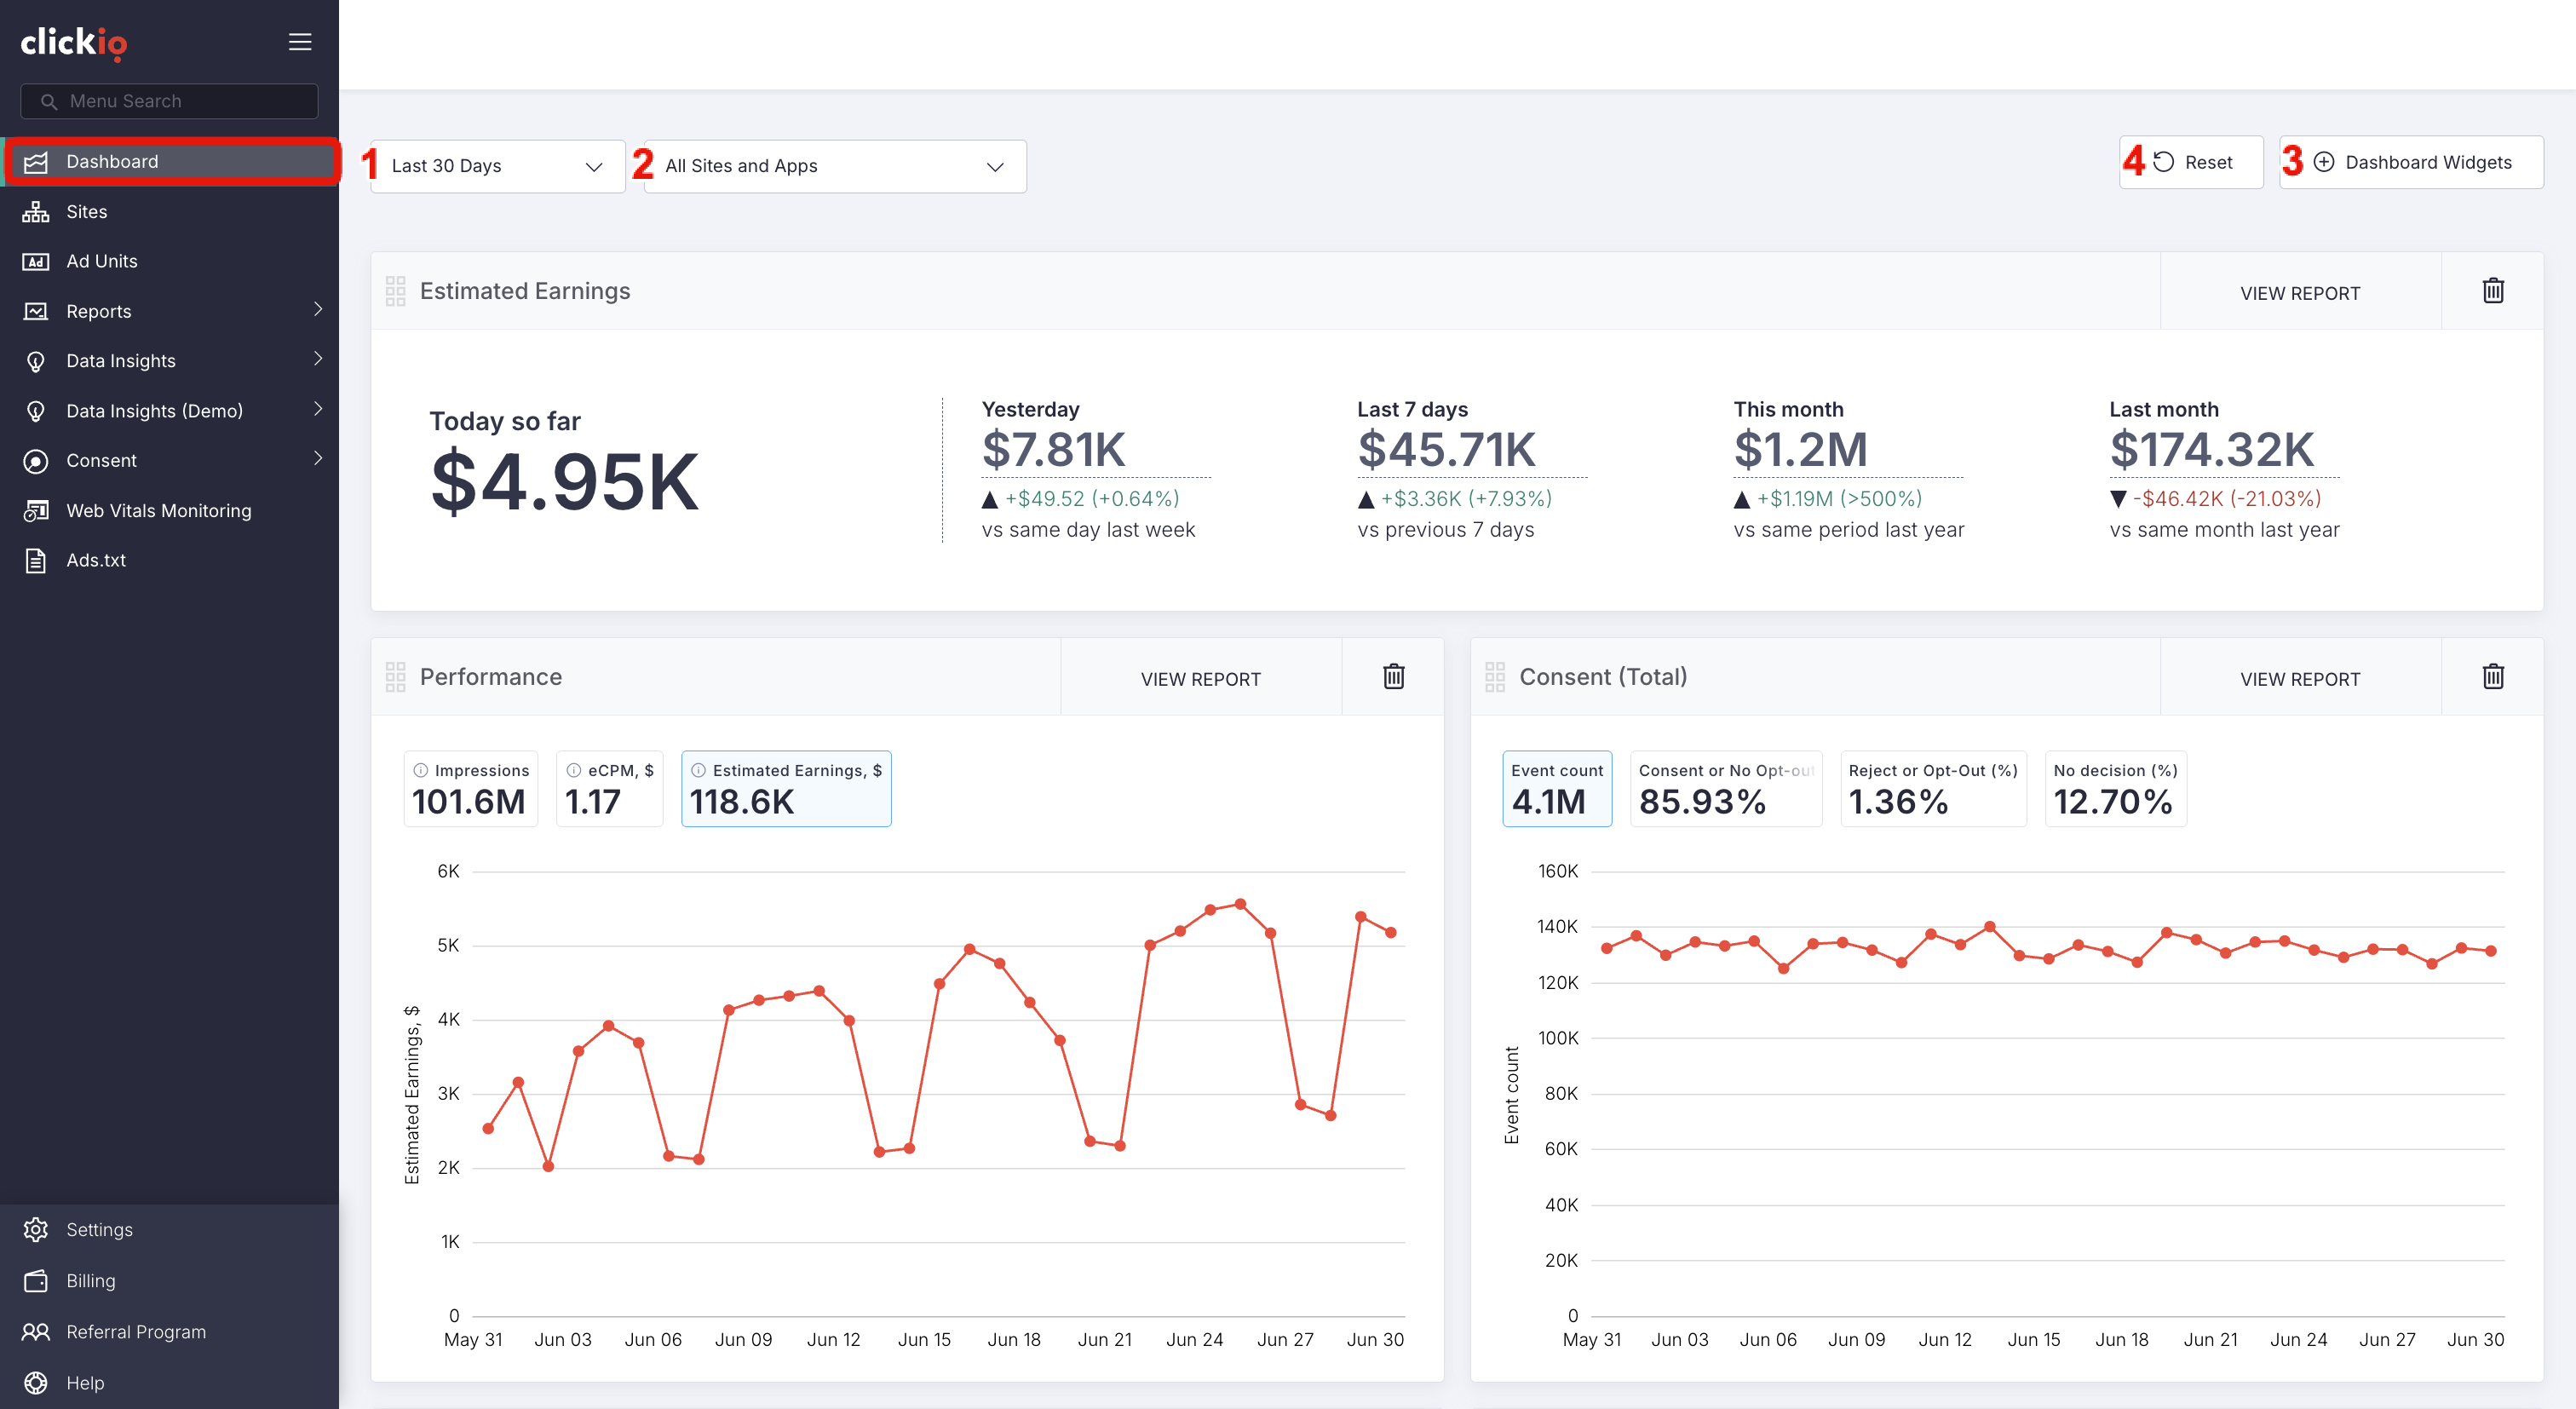
The Dashboard gives you a quick overview of your Clickio account performance. It displays the most important metrics in a collection of widgets that you can customize to suit your needs.
You can use the filters at the top of the page to change the date range [1] or select a specific site or app [2]. The selected filters apply to all dashboard widgets unless stated otherwise.
To customize your dashboard, click Dashboard Widgets [3] and choose which widgets to display. You can also remove widgets directly from the dashboard, drag&drop them or restore the default layout by clicking Reset [4].
Reports
The Reports widgets provide an overview of your earnings and advertising performance.
Estimated Earnings
The Estimated Earnings widget shows your estimated revenue for several predefined time periods:
- Today so far: estimated earnings generated today.
- Yesterday: estimated earnings for the previous day, with a comparison to the same day last week.
- Last 7 days: estimated earnings for the last seven days, with a comparison to the previous seven-day period.
- This month: estimated earnings for the current month, compared with the same period last year.
- Last month: estimated earnings for the previous month, compared with the same month last year.
This widget provides a quick summary of your revenue performance without opening a detailed report.
Performance
The Performance widget displays a line chart showing how your metrics change over time.
You can switch between the following metrics:
- Impressions
- eCPM
- Estimated Earnings
Hover over any data point to view the exact value for a particular date.
Select VIEW REPORT to open the full By Date report.
Balance
The Balance widget shows your payment history.
For each payment period, it displays:
- Payment month
- Payment status
- Final payment amount
This widget always shows your latest payment information and is not affected by dashboard filters.
Sites
The Sites widget shows how your estimated earnings are distributed across your websites or apps.
Depending on the selected visualization, you can display the data as:
- Pie chart
- Line chart
- Bar chart
Hover over a chart segment or data point to see the earnings for a specific site.
Select VIEW REPORT to open the full By Site report.
Ad Formats
The Ad Formats widget shows top five ad formats generate your estimated earnings.
Available chart types include:
- Pie chart
- Line chart
- Bar chart
Use this widget to compare the contribution of different ad formats to your revenue.
Select VIEW REPORT to open the detailed By Ad Format report.
Ad Units
The Ad Units widget displays the top five ad units ranked by estimated earnings.
Available chart types include:
- Bar chart
- Pie chart
- Line chart
Hover over an item to view its earnings.
Select VIEW REPORT to see data for all ad units.
Ad Sizes
The Ad Sizes widget displays the top five performing ad sizes.
Available chart types include:
- Bar chart
- Pie chart
- Line chart
This widget helps you identify which ad sizes contribute the most to your revenue.
Device Targeting
The Device Targeting widget shows how your estimated earnings are distributed across different device types.
Available chart types include:
- Pie chart
- Line chart
- Bar chart
Device categories include desktop, mobile, and AMP.
Demand Type
The Demand Type widget shows estimated earnings grouped by demand source type.
Available chart types include:
- Pie chart
- Line chart
- Bar chart
Use this widget to understand how different demand types contribute to your revenue.
Select VIEW REPORT to view the complete By Demand Type report.
Demand Partners
The Demand Partners widget displays the top five demand partners ranked by estimated earnings.
Available chart types include:
- Bar chart
- Pie chart
- Line chart
Hover over a chart element to view the earnings generated by each partner.
Ads.txt
Ads.txt
The Ads.txt widget shows the ads.txt status for your sites and apps.
For each site/app, the widget displays whether the ads.txt file is correctly configured or requires attention.
Common statuses include:
- Need to Fix: the ads.txt configuration requires action.
- OK: indicate that the configuration is valid.
Use this widget to quickly identify sites that may require ads.txt updates.
Data Insights
The Data Insights widgets help you understand where your traffic and revenue come from.
Each widget displays the top five results for the selected metric.
Countries
The Countries widget shows your top countries by:
- Page Views
- Earnings
- Share of total earnings
Select VIEW REPORT to see data for all countries.
Browsers
The Browsers widget shows which web browsers generate the highest revenue.
The table includes page views, earnings, and revenue share for your top browsers.
Select VIEW REPORT to open the complete report.
Pages
The Pages widget lists the pages generating the highest earnings.
Use this report to identify your best-performing content.
Select VIEW REPORT to see all pages.
Categories
The Categories widget shows earnings grouped by content category.
Use this report to compare the performance of different content categories.
Select VIEW REPORT for detailed statistics.
Authors
This report helps you identify which authors generate the most revenue.
Select VIEW REPORT to see the complete report.
Consent
The Consent widgets help you monitor user consent activity for different privacy regulations.
Each widget displays a line chart showing trends over time.
Consent (Total)
The Consent (Total) widget shows overall consent activity across all supported privacy frameworks.
Available metrics include:
- Event count
- Consent or No Opt-out (%)
- Reject or Opt-out (%)
- No decision (%)
Select a metric to update the chart.
Consent (GDPR)
The Consent (GDPR) widget shows consent activity for users subject to GDPR.
Available metrics include:
- Event count
- Consent (%)
- Reject (%)
- No decision (%)
Hover over a data point to see the values for a specific date.
Consent (US)
The Consent (US) widget shows consent activity for users covered by US privacy regulations.
Available metrics include:
- Event count
- No Opt-out (%)
- Opt-out (%)
Use this widget to monitor consent trends over time.
Web Vitals
The Web Vitals widgets help you monitor the performance and health of your websites.
Web Vitals Status
The Web Vitals Status widget displays the current status for each site.
Possible statuses include:
- Compliant
- Not compliant
- Collecting data
Use this widget to quickly identify sites that require attention.
Core Web Vitals
The Core Web Vitals widget displays compliance with Google's Core Web Vitals metrics.
Available metrics include:
- LCP Compliance (%) – Largest Contentful Paint
- INP Compliance (%) – Interaction to Next Paint
- CLS Compliance (%) – Cumulative Layout Shift
Select a metric to display it on the chart and hover over a data point to view the value for a specific date.