Clickio Web Vitals Monitoring Report
To access the Clickio Web Vitals Monitoring report, go to the Web Vitals Monitoring tab and click the Open button in the Statistics column.
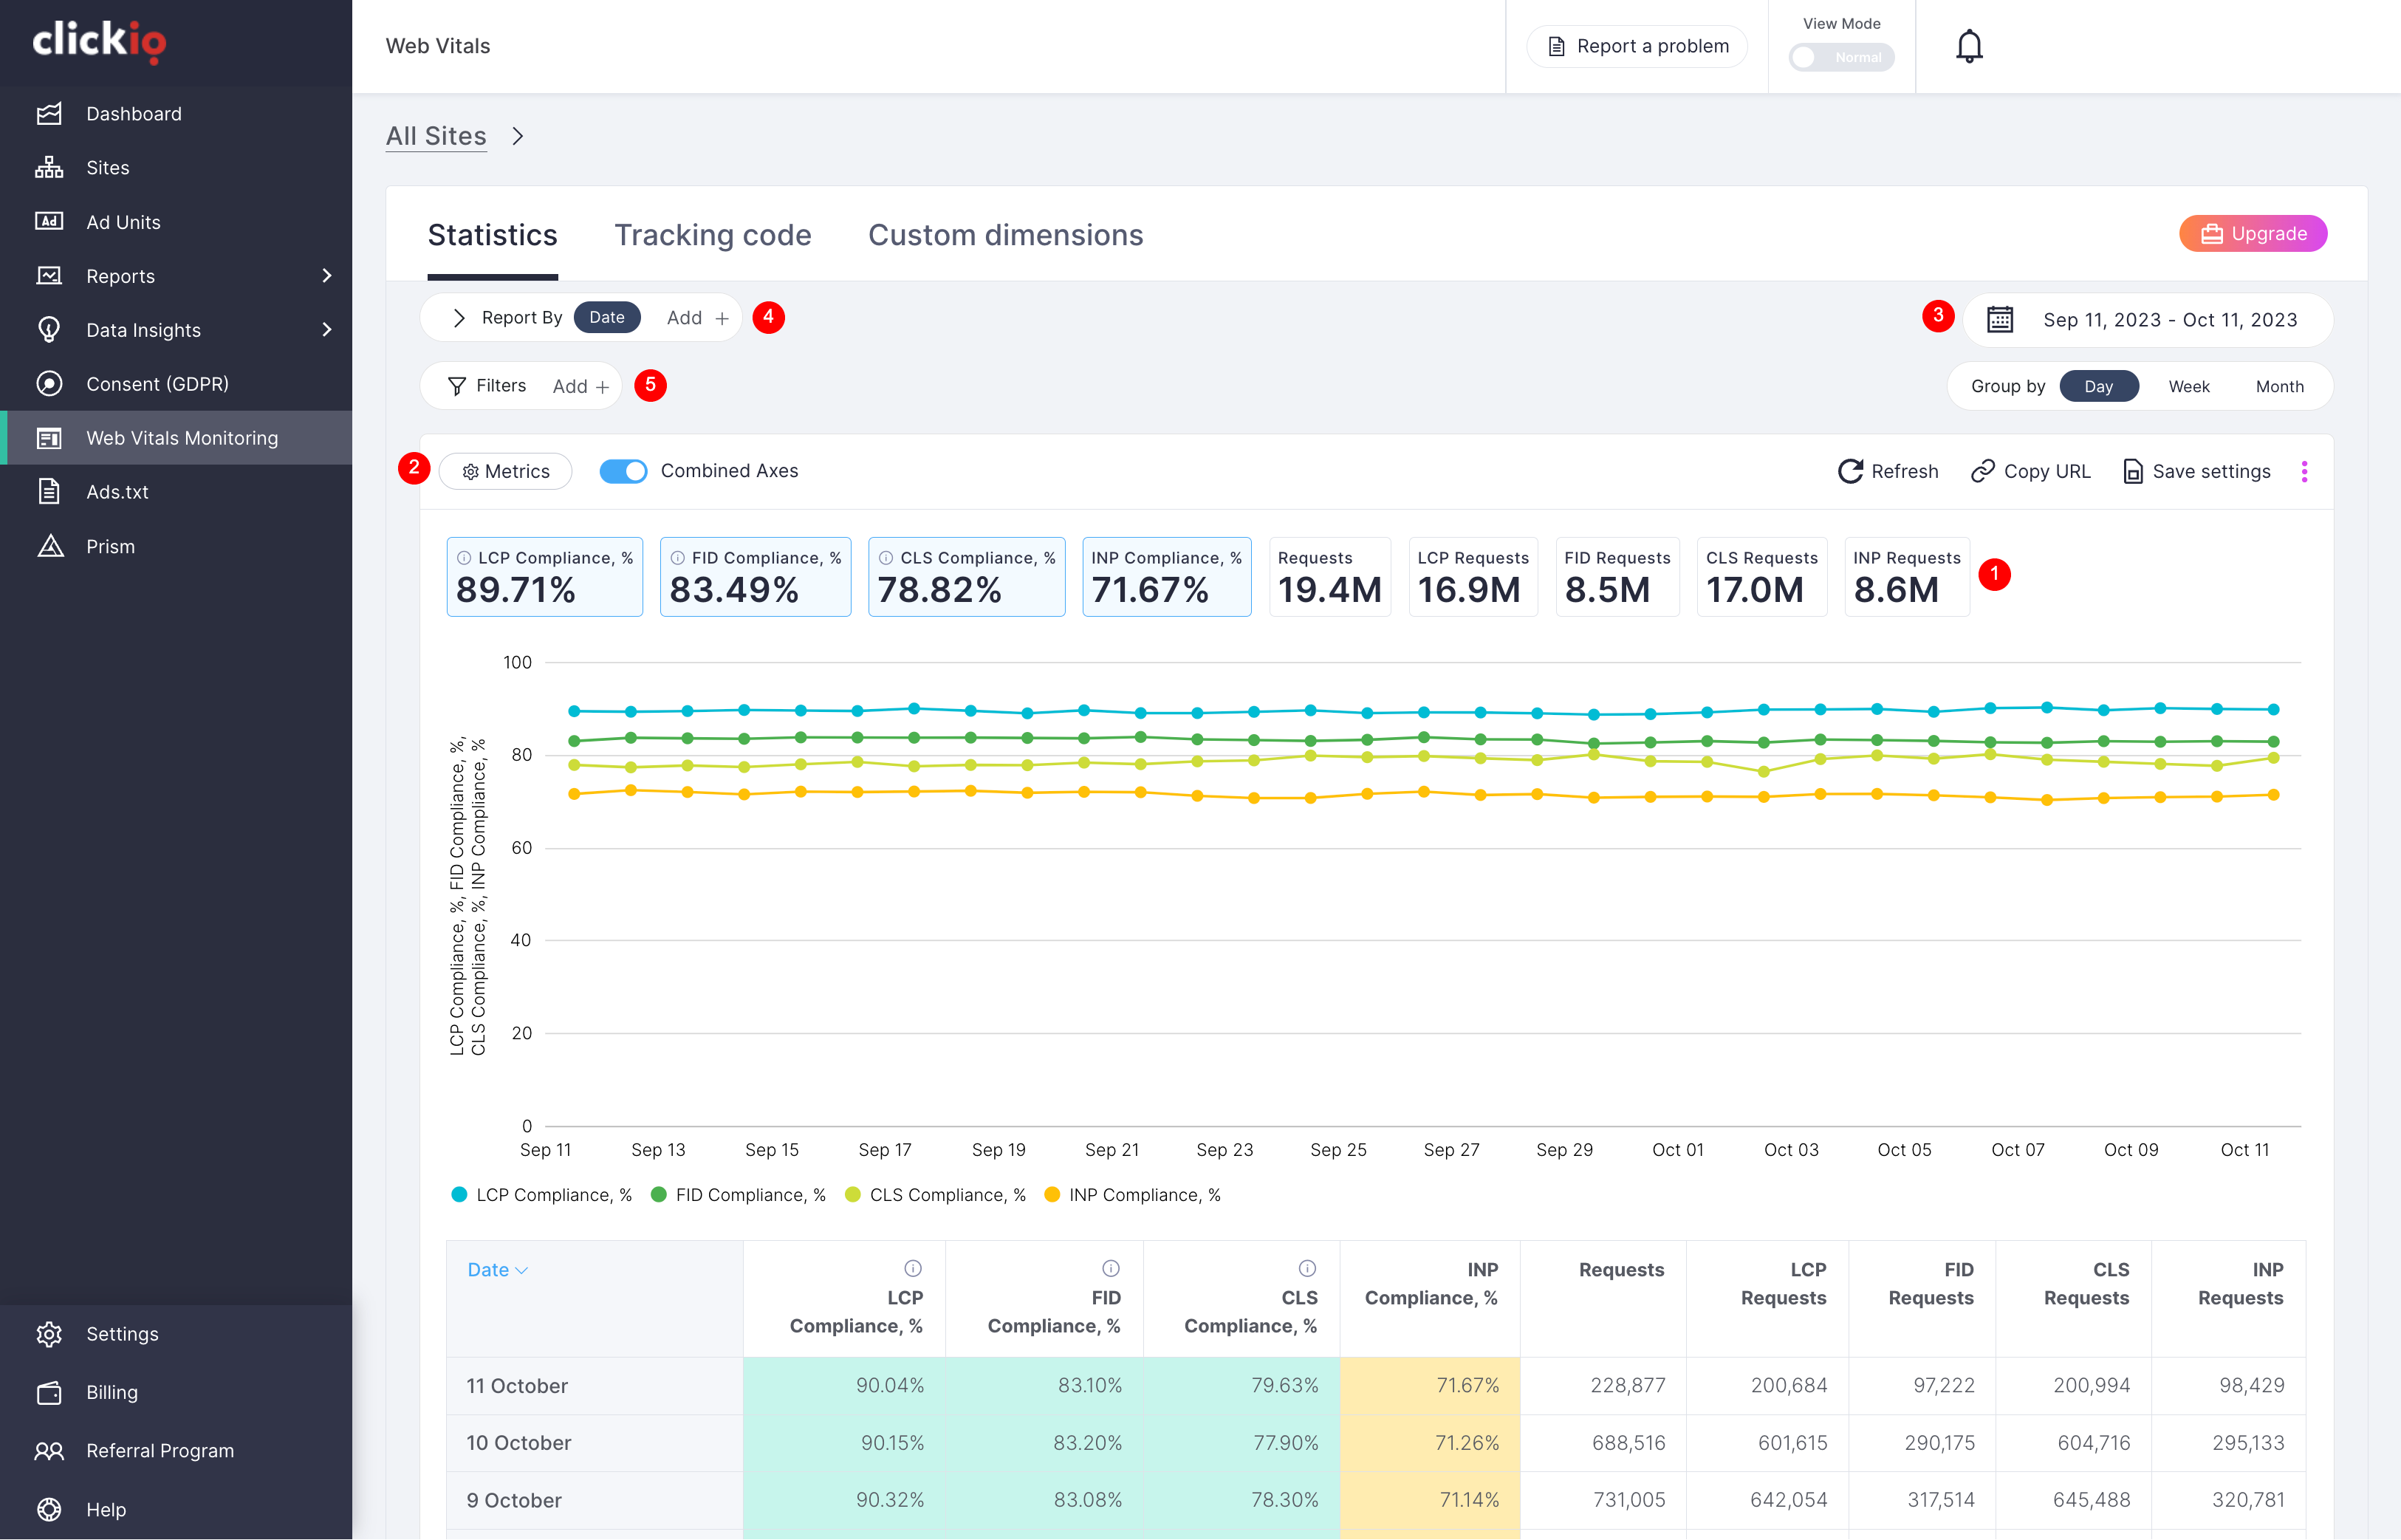
- Manage chart. To adjust the line chart view, select the metrics you wish to be displayed on the graph.
- Manage table. To adjust the table view, click the Metrics button and select the metrics you wish to be displayed. Removing a metric from the table will also remove it from the list of metrics available to view in the chart.
- Calendar period. To change the period shown in the chart and in the table, go to the calendar and set the date range. Data can be grouped by day, week or month.
- Available Dimensions. In the Clickio Web Vitals Monitoring report, you can create reports based on the following dimensions:
-
-
- Date
- Country
- Site (not available in Free plan)
- Client OS
- OS version
- Browser
- URL (not available in Free plan)
- Site version (available only for publishers with active Prism technology)
- Device type
- Resolution
-
- Filters. The data in the report can be further refined by applying filters to:
-
-
- Country
- Site (not available in Free plan)
- Client OS
- OS version
- Browser
- URL (not available in Free plan)
- Site version (available only for publishers with active Prism technology)
- Device type
- Resolution
-