Reports Tab
The Reports section provides various pre-made reports, including By Date, By Site, By Ad Unit, By Ad Format, By Device, By Platform, and By Demand Type.
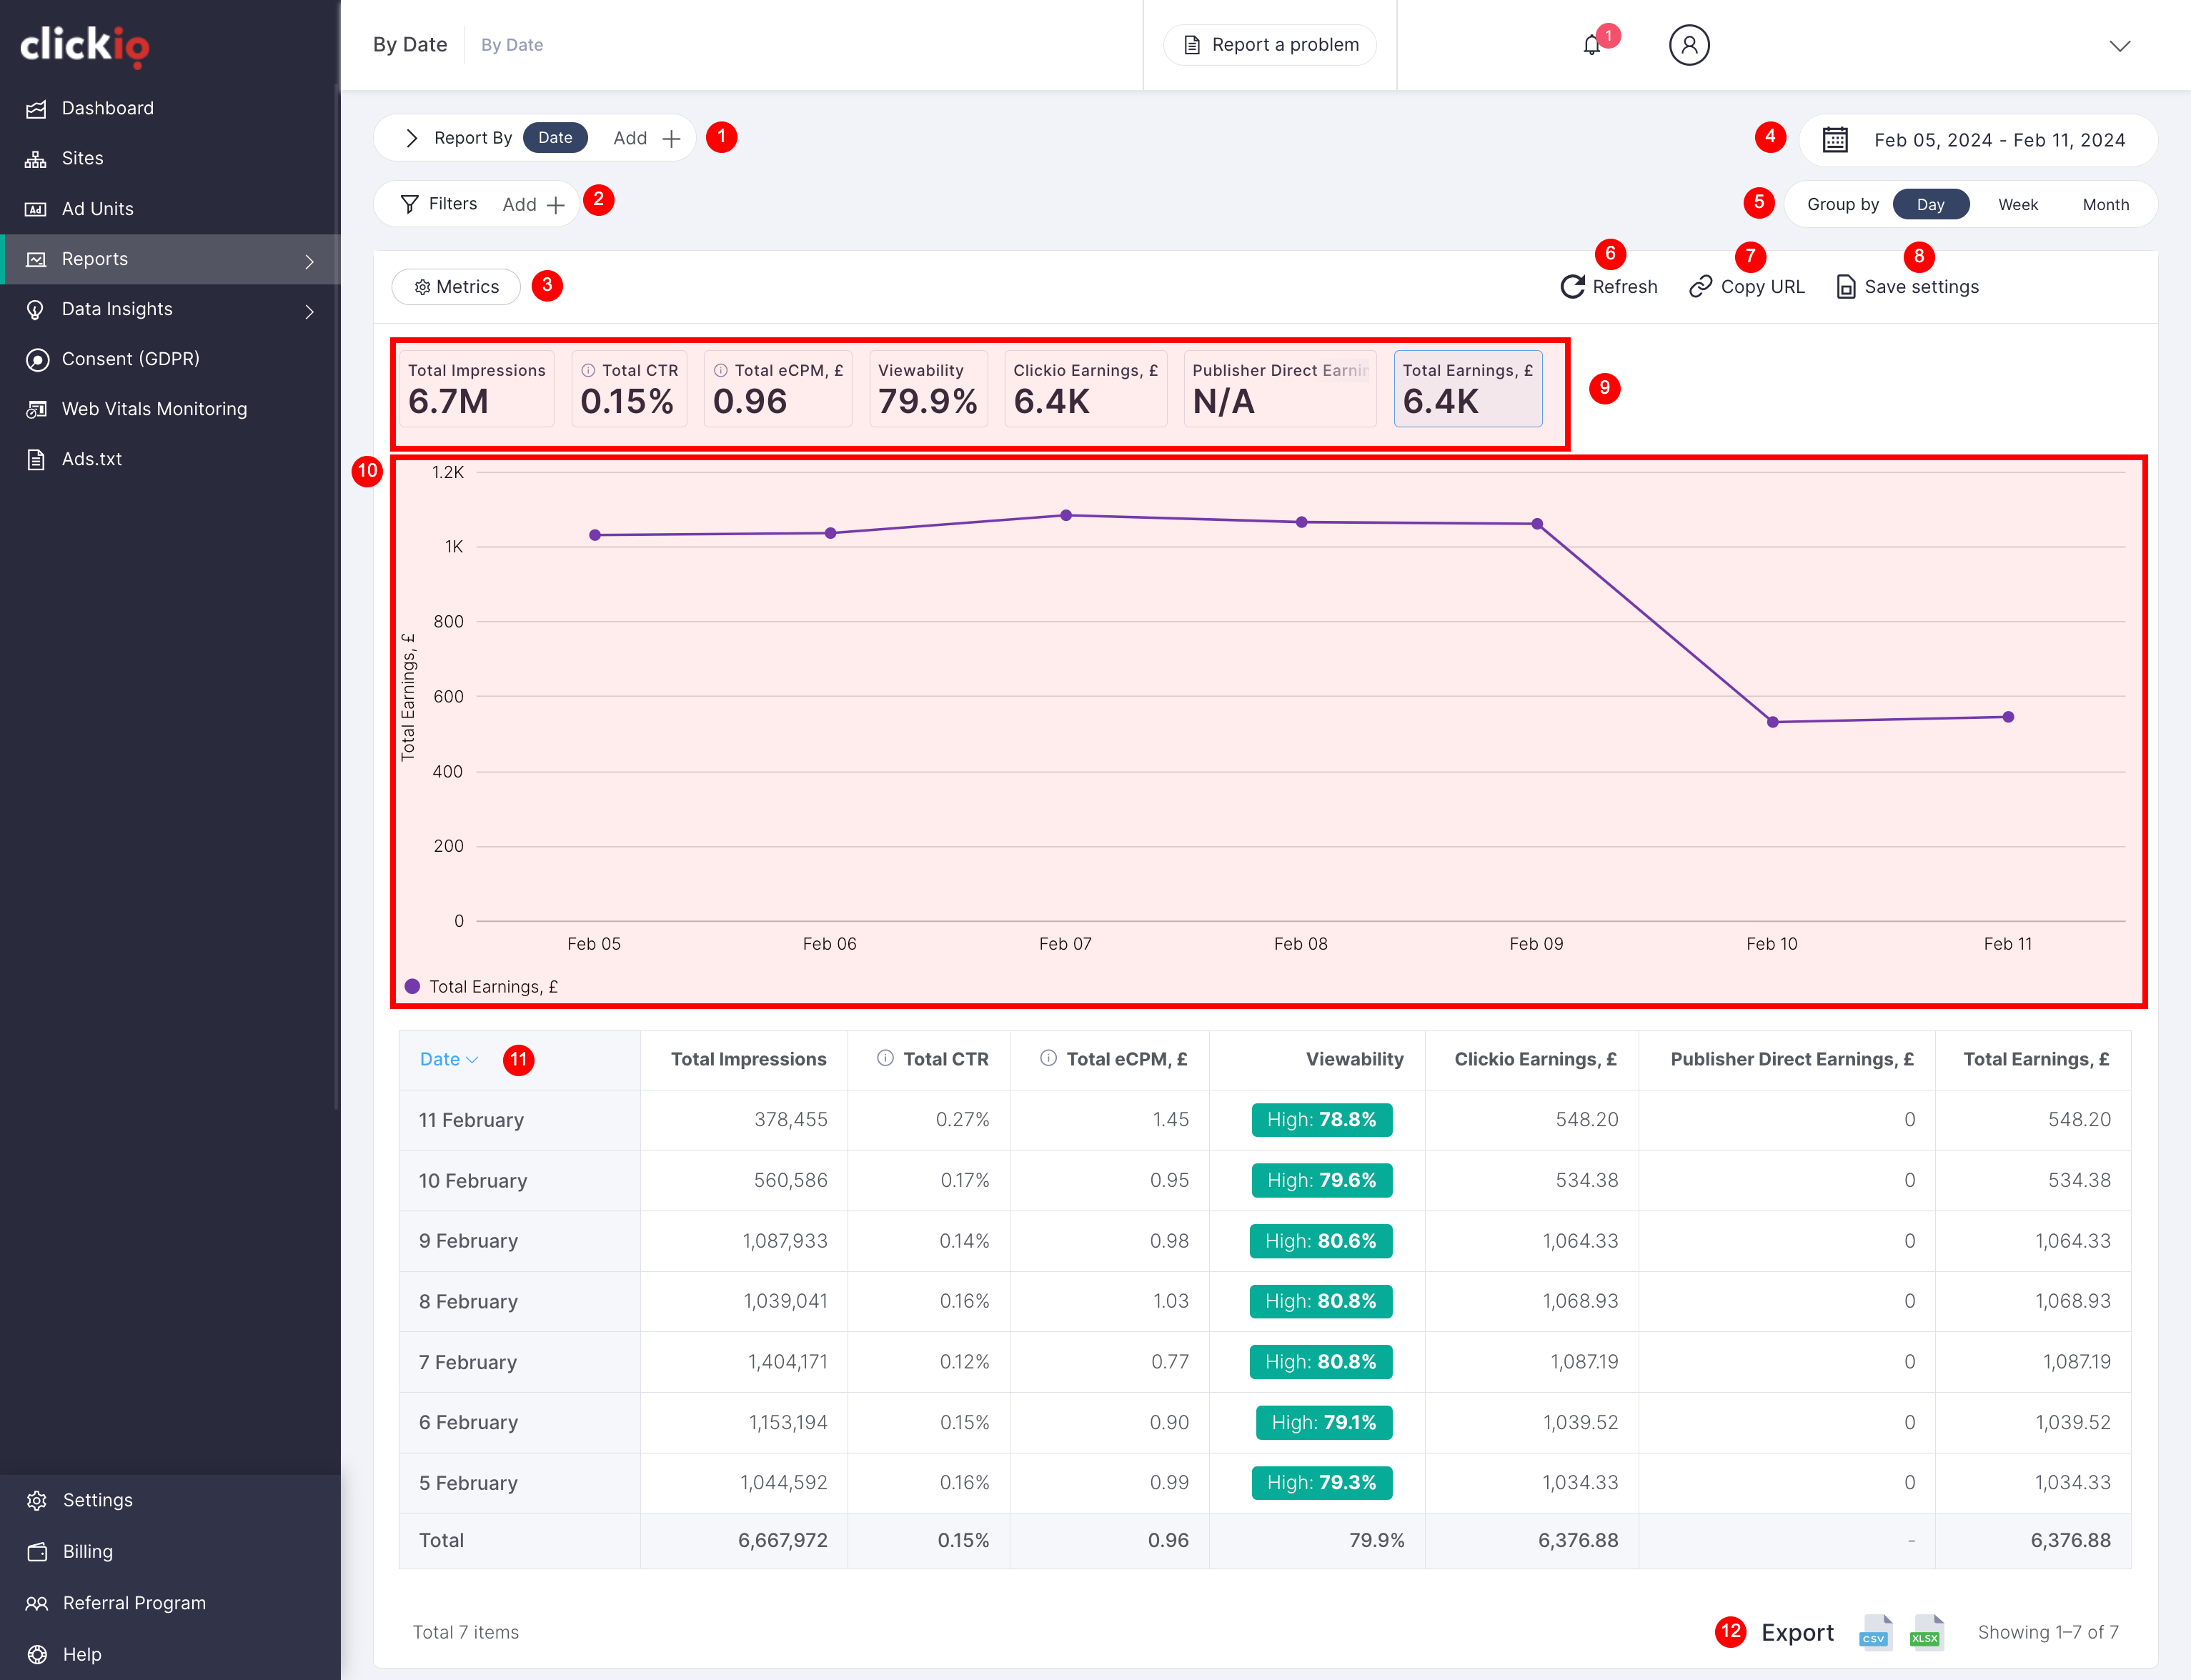
1. Dimensions: Dimensions determine the displayed data and their order influences the presentation. Utilize the search box for quick navigation and add multiple dimensions to further break down your data.
2. Filters: Drill down into your data using filters, applicable to both Dimensions and Metrics. Refine your data with multiple filters and use the search box for swift navigation.
3. Metrics: Control which metrics appear in the report and adjust their sequence by dragging them up or down. Navigate quickly using the search box.
4. Date Ranges: Run reports for any available date range. Choose from preset dates or set a custom range.
5. Group By: Select grouping options — day, week, or month.
6. Refresh Data: Update the report data while retaining selected settings.
7. Copy Report URL: Customize reports with dimensions, metrics, filters, and date ranges. Clicking this button adds a special parameter ?state= to the URL, enabling sharing for consistent views.
8. Save Settings: Preserve custom report settings for future use.
9. Scorecards: View total metric values for the selected period in a compact design. Choose metrics for the line chart by clicking on any scorecard; simultaneous viewing of more than two metrics is possible.
10. Line Chart: Visualizes the date dimension on the X-axis and metric measurements on the Y-axis.
11. Table: Displays selected dimensions and metrics in a tabular format.
12. Export Data: Export report data in .csv or .xlsx format for further analysis or storage.