Dashboard
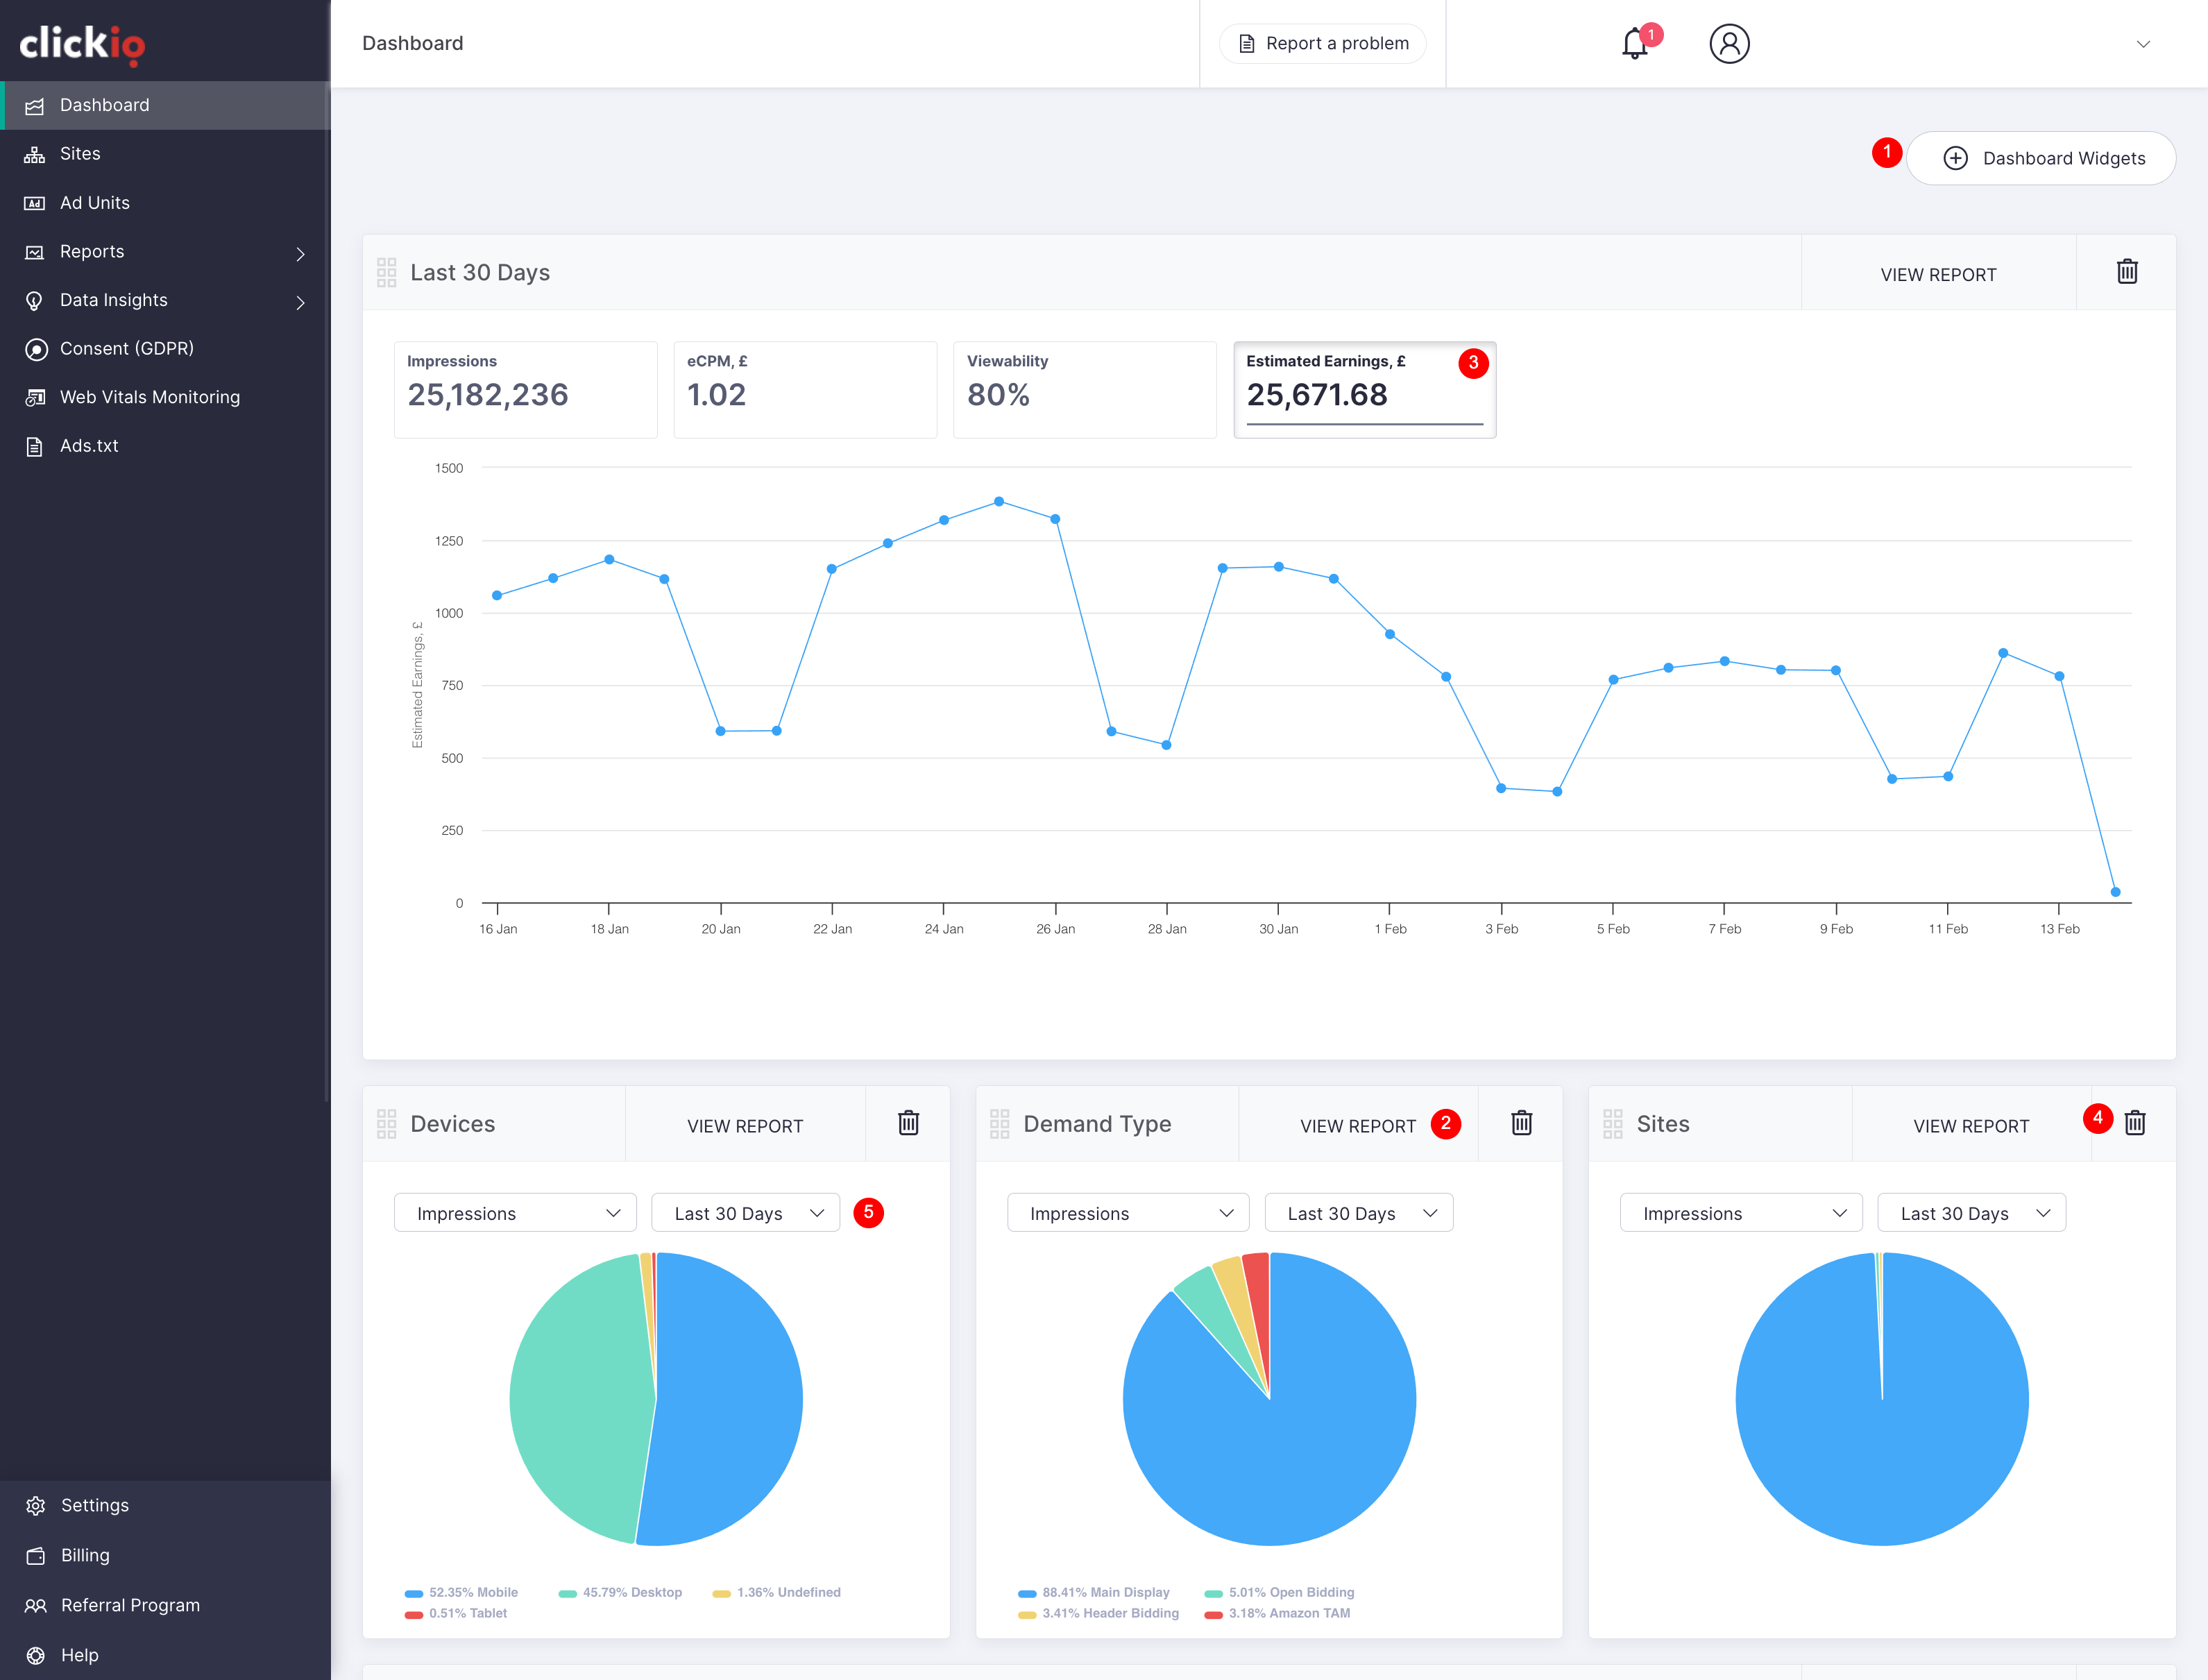
1. Customize Dashboard Widgets: Easily customize widgets on your dashboard. To add a new widget, simply click on the "+ Dashboard Widgets" button, then select your desired widgets to add to the main dashboard.
2. Access Detailed Reports: View detailed reports by clicking on the "VIEW REPORT" button.
3. Utilize Line Charts: Display two metrics simultaneously on the line graph. To add metrics to the graph, just click on them.
4. Delete Widgets: Remove widgets from the main dashboard by clicking on the delete button.
5. Change Pie Chart Representation: Modify the chart representation by clicking on the arrows and selecting from the available options.